The 2017 Market
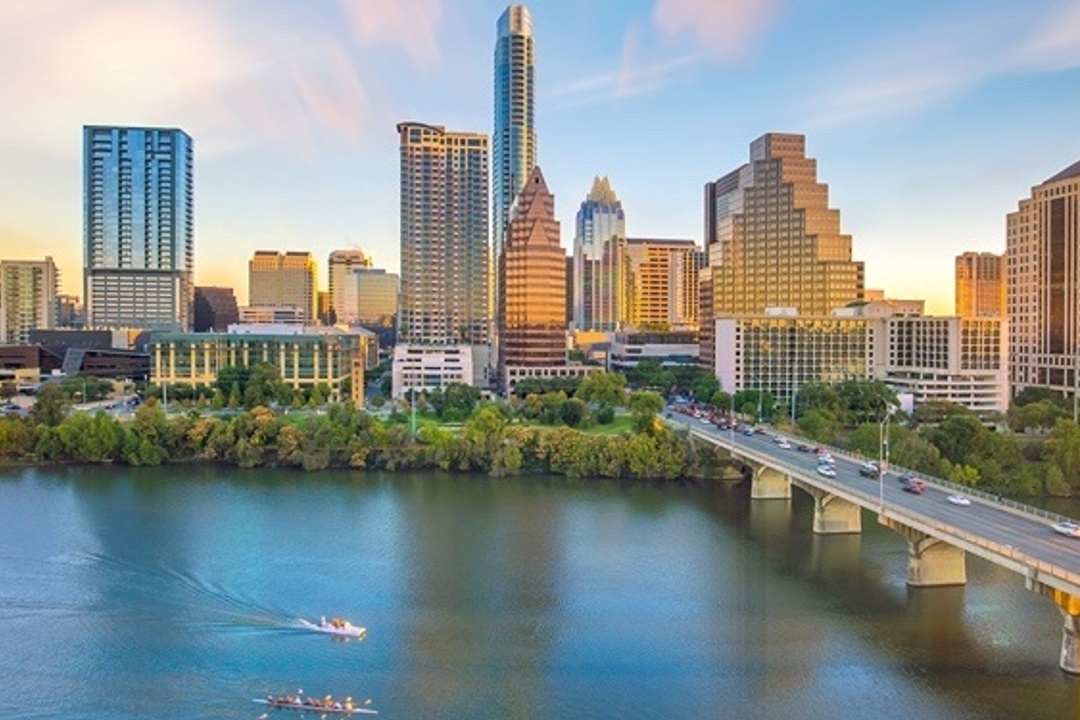
In 2017, we wrote about the cost of rent in the Austin area (you can read the 2017 article here). In particular, desirable zip codes at or near downtown showed the highest rents, with opportunity, proximity to work, and amenities drove rates up. 2018 continued that trend with high rents in desirable areas. This year, we wanted to take a close look at rents in the Austin area to see if the trend had continued.
In our article, we looked at the median rent for a one-bedroom apartment across the Austin area by zip code. This data, first accessed by EverythingAustinApartments.com, painted a picture of the most expensive and least expensive zip codes in Austin.
Since then, with continued growth in the Austin area, we’ve seen more and more interest in rental data as of mid-2019. Consumers have seen the growth in the area and are making plans to relocate to the city. Whether that’s for jobs or access to venues and entertainment, Austin is growing, and consumers want to know what the market looks like today.
Getting a snapshot of the market in 2019
For 2019 we decided to use the Zillow Rent Index (ZRI). The ZRI offers a more precise look at the market accounting for not only one-bedroom apartments, but for all housing. This includes single-family homes, condos, 1 to +5 bedroom, and multi-family housing. Using this index, we can get estimated rents for the same zip codes we examined in 2017.
The goal of using an estimate versus homes on the market is “to give consumers insight into rental price trends in a way that is not biased by the mix of homes currently for rent.”
It is often hard for consumers to make informed decisions solely based on available housing. By using this index, we hope to paint a more accurate picture of the recent Austin rental market from 2018 to 2019 and explore possible trends in the market.

5 Most Expensive ZIP codes:
78746 - ZRI $4085
The Westlake area again made its way into the most expensive category. In 2017 this zip code made our top 5 most expensive zip codes, most likely because of the concentration of valuable real estate in the area. Additionally, homeownership is high in this area, meaning that most rentals are high end single-family homes and condos. The area is very sought after, and with an average household income of $217,305, homes are on the higher end of the market.
78703 - ZRI $3257
78703 is another zip code from the Westlake area. In 2017 we listed “Downtown, Tarrytown, and the Enfield neighborhoods,” and their proximity to this area, as reasons why it is so sought after. This zip code is made up largely of renters. There is a smaller supply of available rentals as fewer people are moving out and available homes tend to be at the higher end of the market, leading to higher rents.
78730 - ZRI $3200
78730 was not listed in our top 5 in 2017. It is just north of 78746 (the most expensive zip code). The homes in this area have an average value of $724K, with amenities and golf courses nearby, a homeownership rate of 60.7%, and an average income of $183,000. As we saw with other high rent zip codes, with fewer options for rentals and higher home values, rents generally are higher.
78731 - ZRI $3094
Known to many as Northwest Hills, this area saw most of its development from the 1960s through the 1980s. Homes in this area are well established with big yards and mature trees. They are valued at just over $600K on average. Homeownership is at a rate of 56%, but the area is also popular with those attending local colleges and universities. The average drive to work is just under 20 minutes, making accessibility a huge selling point.
78732 - ZRI $2755
Before it’s founding in 1987, the area known as Bee Cave, was known as a retreat from city life due to it's location. The population has grown substantially over the years. The US census reported a total population of 656 in 2000 and 17,762 as of the most recent survey. A small-town feel and highly sought after schools have made Bee Cave very popular to people looking for housing in the Austin area. With an average home value of $595K and an average commute of 35 minutes, this area still attracts those looking for a retreat from city life.
Percent Change In Median Rent:
An even more surprising indicator of the changing Austin market is the percent change in rent from 2018 to 2019. While the majority of high rents seemed to be focused in the Northwest region of the market, percent change in rents seemed to be concentrated on the south side.
Out of the top 5 zip codes with the highest rents, none of them made the top 5 zip codes with the most significant percentage increase in rent. The greatest increase was in 78703, which saw a rise of 3.7% (the highest out of the top 5). According to the U.S. Bureau of Labor Statistics, 3.5% is the national average increase in housing per year.
Rents increased for every zip code we looked at in Austin Market from 2018 to 2019. However, 21 of the 40 zip codes we looked at came in under 3%.

78702 - 6.2%
This area is known as East Cesar Chavez and is one of the oldest areas in Austin. With historic homes and a tie to cultural centers, the district has seen increased growth as more and more people seek to live here.
The area has seen its share of development that has contributed to a rise in rents almost double the national average. Of note are the Rainey Street neighborhood's selection as part of Austin's central business district in 2004 and the 1999 City of Austin “Neighborhood Plan,” which promoted mixed-use development in an area once dominated by single-family homes. In fact,“the City of Austin's Department of Planning, property value in East Austin's 78702 ZIP code increase more than 100 percent from 2000 to 2005”.
78722 - 6.0%
The Mueller area sought to “create a district that would be a model for responsible urban development.” Housing and development incentives were given in an attempt to connect residents with affordable housing and jobs. With a median rent ZRI of around $2000, this area one of Austin’s most affordable neighborhoods if you can find space.
Homes have been a big push in the area as the development has worked to create new types of housing. Row Houses (townhomes), Condominiums, and other mixed and multifamily housing units are some of the most prevalent developments in the area. As of December of 2018, 569 apartment units were leased compared to 433 homes completed and sold. During the same timeframe, 132 apartment units were under construction.
The area is certainly attractive for those looking to put down roots in an up and coming community. But, supply and demand will always win at the end of the day.
78704 - 5.6%
Known as South Congress, South Austin, or SoCo, this area has been one of the cultural and historical epicenters of Austin. Regarded for its shopping, venues, and restaurants, it also has a mix of new and old construction. During the 1990s, redevelopment started with historic buildings and increased the demand for housing.
With a mix of traditional homes and condominiums, the proximity and accessibility have made this area the place to be with those new to Austin as well as long-time residents. As development continues and the area becomes increasingly more popular, it’s not surprising we have seen such a jump in rents. As the city grows and incorporates more areas (such as 78705), we can expect to see rents increase in those areas as well.
78749 - 5.5%
78736 - 5.2%
As Austin has experienced a recent boom in business and opportunity, historic areas have been sought out to meet housing demands. This has definitely proven true for the Oak Hill area. “Over the ensuing decade(the 2000's), the combined Oak Hill planning area saw rapid population growth, more than twice as rapid as the Greater Austin metropolitan area. West Oak Hill saw population growth three times more rapid than Austin in the same time period.” The rising percentage in rent could be directly related to the vacancy rate in 78746, which is at 3.3% for both residential and rental property.
What does the future look like?
Inexpensive rents are on the rise in Austin. Increased population + increased demand + fewer housing options = rising rents. As the rental pool dries up, new residents seek out homes with cheaper rents in established neighborhoods. Developers have anticipated this and have already begun revitalizing areas, opting for apartments, condos, and rentals where single-family homes once stood. As this trend moves forward, we will see one of two things: a greater push Southwest or further revitalization within the city itself. Only time will tell if rising rents are a lasting trend or simply increasing to stabilize at a new normal.
Sources:
Average Income and Home Ownership Data - Esri Tapestry Segmentation Dataset
Consumer Price Index Summary - Bureau of Labor Statistics

